
Debugging Interesting Bugs at PostHog
This week, I ran into an interesting bug. We would send session recording data to our client’s servers instead of our own. This is pretty annoying - we’re losing data, polluting our client’s logs, oh and it happens often, but we can’t reproduce it.
I think it’ll be fun to walk through how I solved this bug. And since PostHog is open source, we can walk through the actual code instead of a make-believe alternative.1
There’s 4 things I hope you (and I) get out of this post:
- Figure out different approaches to solving this bug.
- Draw general principles that would be useful elsewhere.
- Figure out how to apply these principles more effectively in the future.
- Have fun solving this bug
Context
PostHog has a main app: a Django backend and React frontend, which manages analytics. This is where you’d come to see analytics for your website. Then, there’s the integration libraries: you’d run these on your website - a snippet - that manages sending requests to PostHog, auto capturing events, doing session recording, etc. etc.
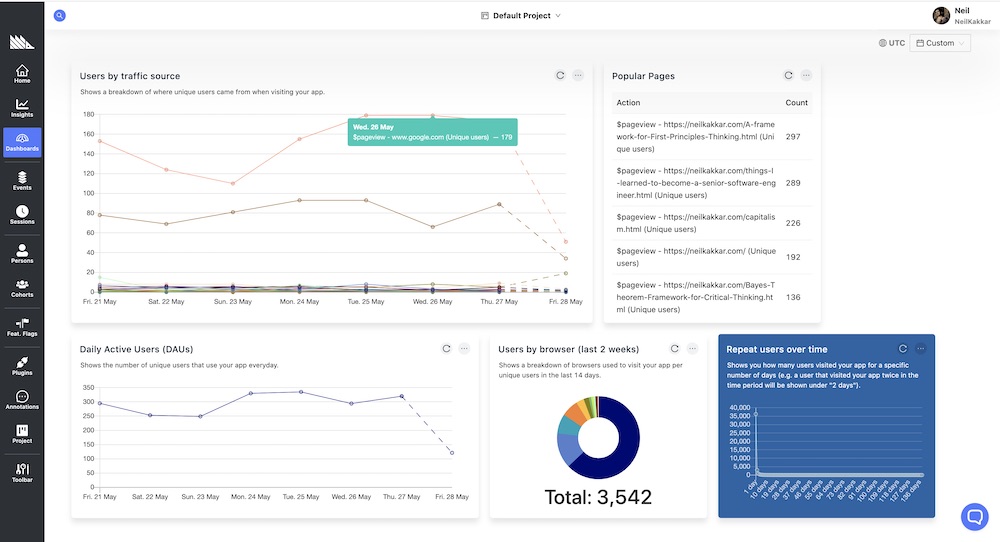
How PostHog looks like on this website
We’re dealing with the posthog-js library. The session recording extension in PostHog-js manages session recordings. When things work fine, We capture these recordings and send them to the /s/ endpoint on the main app.
When things don’t work fine, we send random requests to /sessionRecording, instead of where PostHog is being hosted.
What makes this bug tricky is that it’s hard to reproduce. We know it happens for a LOT of people, but we don’t know exactly when or how. And this is indeed Principle #1 for any bug you’re trying to solve.
Principle 1: Reproduce the bug
For the easy bugs, a good test is all it takes to reproduce. This makes things so much easier, since if you write the test first, see it fail, and then write the code to fix it, bam, you’re done!
The hard bugs require you to set up the entire flow, imitate the user and see where they run into issues. As you can imagine, the /sessionRecording bug is of the second kind, which is what makes it blogpost worthy.
PostHog: Reproducing the bug
Well, before I can reproduce anything, it’s a good idea to setup my development environment, so everything is local, and I can tweak things the way I want to. This bit is interesting in itself, since setting things up is non-trivial: you create a sample website to use as a playground, add the snippet that talks to PostHog, and run PostHog locally to ingest those events. There’s a bit more to it, but it’s probably not worth getting into it right now.
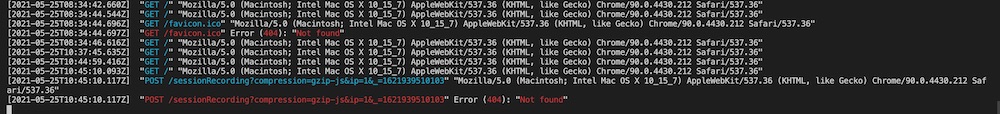
Since we’re dealing with a local web server, I set up http-server - which would tell me all about the requests coming in. Now, I somehow need to make the /sessionRecording request come in. Enable session recording on the server side, enable it on the client side, some fumbling around, refresh, and sure enough, I got a few /sessionRecording requests.
I realised I’d get a new /sessionRecording request 50% of the time after a refresh. I considered this a good enough rate to dive deeper.
Next step is to figure out which one of the 30,000 lines of code is the problem. I’ve found that the best way to figure anything out is to make hypotheses, test if they’re right or wrong, and repeat. Every wrong answer gives you more insight into what to try next. If this sounds familiar, yes, it’s exactly the same as the framework for critical thinking.
PostHog: Testing what went wrong
The first thing I’d do is grep for sessionRecording. Find where the damn URL is being generated, and we’re done! In fact, I did this even before trying to reproduce the bug - sometimes, that’s all it takes.
Well, this bug was blogpost worthy, so it obviously wasn’t that simple. You can search for sessionRecording in the repo . The only place worth looking is in sessionrecording.js, which doesn’t make sense. Maybe the string is being generated somehow? or a third party library is doing it?
Note:
If you’re following along, use this non-master branch, since I’ve already merged the fix into master
My focus areas now would be every part of posthog-js that makes an HTTP request somewhere. If requests are being made from the client, the DevTools must have captured this request too!
That’s where things start to get even weirder. I could see the requests coming to my http-server:
but not on the DevTools network tab:

Can you guess why?
The /sessionRecording request would come right after I hit refresh.2 …Maybe I was wrong about this, and it was right before refresh. Since I wasn’t preserving the logs, those requests would vanish.
Sure enough, preserving the logs showed the request:
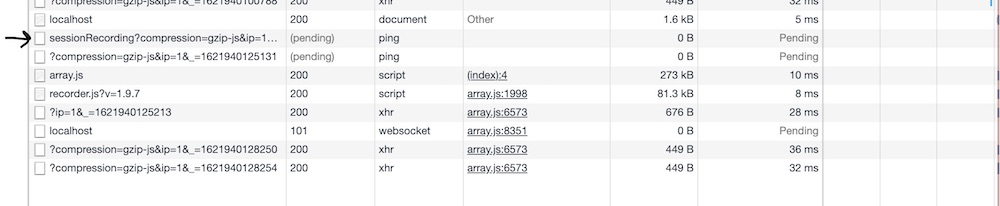
The first thing that caught my eye was how this was different from a regular XHR request. A ping ? What, how is this happening? A few google searches led me to the ping attribute of the anchor tag. Is there code turning HTTP requests to <a> tags? Not sure. I don’t see the DOM changing. This track didn’t lead me anywhere. Maybe other things can generate a ping type request, too?3
So, I decided to move on. Here’s what we know so far:
- These requests are made by the client.
- They’re made right before refreshing.
- They’re different from usual XHR requests.
It smells of a cleanup script running, but the codebase is huge: hard to traceback where this is coming from yet. So, it’s time to get dirty with the code to figure out the traceback.
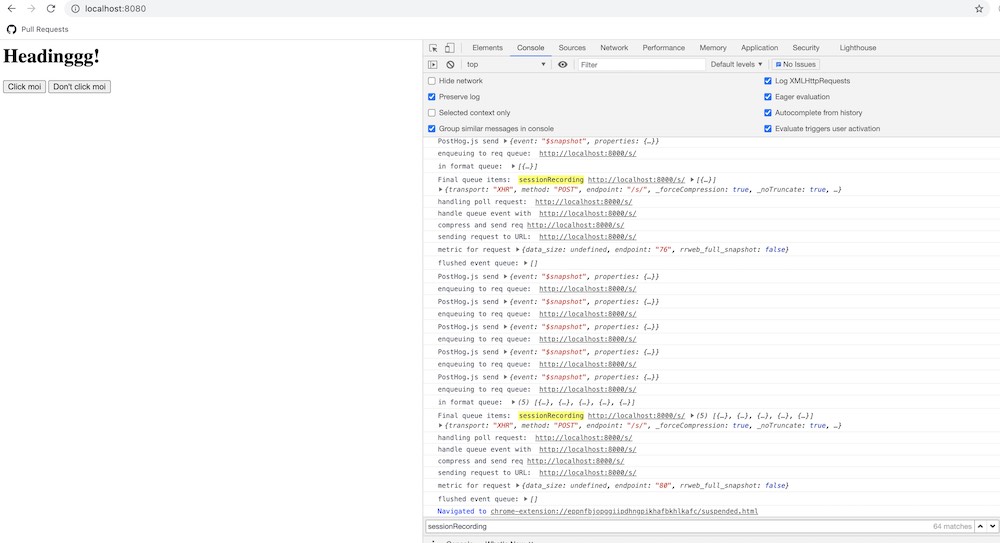
Well.. let’s console.log this shit up. (Yeah, I know now this is a bit very n00by). I’m looking for the url parameter, specifically where it equals sessionRecording. It took a while, working my way up to the right piece of code.
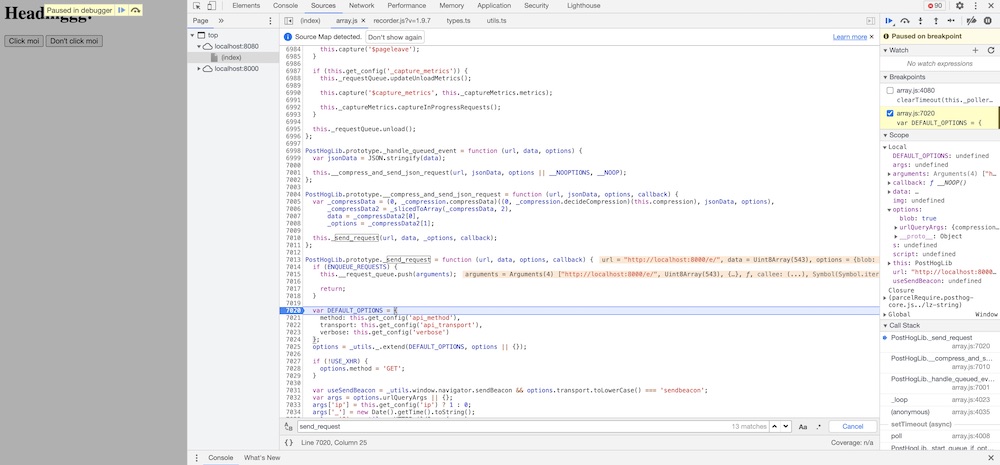
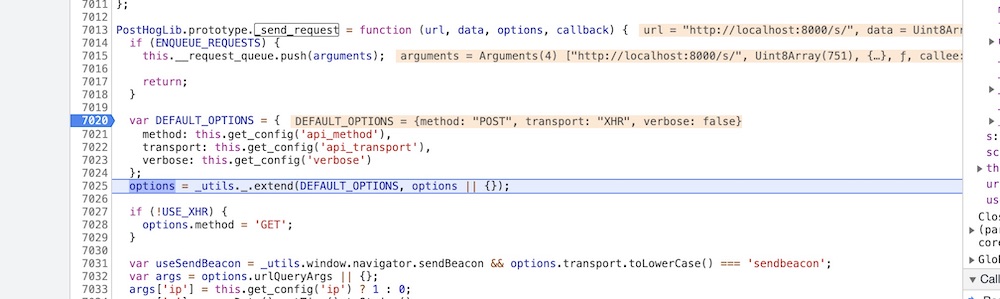
We’ll skip all that n00b logging and move on to the final piece. The culprit is somewhere in here:

Full file on Github
Can you guess what’s wrong?
I’ll help with some console.logs: this.formatQueue() returns something like:
Rebuilding that myself:
{ 'sessionRecording': { '/s/', binary_data, {transport: 'sendbeacon'}},
  '/e/': {'/e/', binary_data, {transport: 'sendbeacon'}},
}
The key is sessionRecording because of formatQueue() - the batchKey takes precedence over the url.
This should make things clear. The bug was because of unload(). Here’s the final PR.
I think there’s lots to generalise from this experience, so let’s ground out the remaining principles.
Principle 2: Make and test hypotheses
What distinguishes fast debuggers is how quickly they cut down the search space by making good hypotheses.
The 30,000 lines of code are your search space. Through testing hypotheses, you discard lines of code that can’t possibly be the problem.
Grepping is useful because if it works, it narrows the search space down to a few lines of code.
Making and testing hypotheses is a bit trickier than it sounds. For example, consider when the /sessionRecording requests happen. I’d refresh my local website, switch screens to the server logs, and sure enough, I’d find the /sessionRecording POST request there (sometimes). This information wasn’t enough to figure out whether the request happened right before, or right after the request.
Computers are much faster than humans, so our usual intuition about timings don’t work here. I inferred the test results incorrectly. I should’ve seeked disconfirming evidence, like every hypothesis demands.
PostHog: Doing things better
Coming back to our bug, I’m still not happy. I was pretty slow. This was n00b level debugging - as you can see from the 100s of console.logs I put in the code. There has to be a better way.
Making and testing hypotheses is a 2 part problem. The first part is making hypotheses, which depends on your brains and how well your tools uncover places to look.
The second part is testing those hypotheses. I was pretty slow here, because I wasn’t relying on the right tools. I figured two optimisations I could make:
- Switching my development settings so instead of a minified js code for the client, I either get a source map, or non-minified code.
- Using breakpoints in Chrome DevTools (it’s surprising how amazing these have gotten)
I didn’t realise until after that both of these were available options. So, I tried debugging the code again, using chrome dev tools.
Chrome DevTools
This is pretty cool: it shows me what console.log would have, but better: I don’t have to log everything myself.
zoomed in
… However, it didn’t help me debug this specific problem better: unload events are unreliable, and Chrome does a poor job of breaking on unload. Stack Overflow had some answers but none worked as well as I’d expect. Disappointing, but I imagine this would work well for something happening not at the end of a page load.
Principle 3: Better tools make things easier
Imagine people in a jungle shouting “it’s here!” to indentify target animals, instead of using a radar. It’s harder, unreliable, and doesn’t always give the full picture. That’s what console.logging is, compared to a debugger.
But hey, sometimes, radars don’t work either, and you have to revert to more primitive options, like in the example above. If there’s one thing, it’s that console.log is resilient.
I feel on aggregate, I’d end up doing things faster with a radar debugger: it’s the difference between seeing only what I focus on - since I’d log things I want to focus on - versus seeing everything, and choosing what’s interesting and what’s not.
Principle 4: Write Tests that fail
So, we’ve figured out the bug. Do we just fix what was wrong and call it a day? Nope, never!

Once you think you’ve figured things out, you need to test your solution works, just like your hypotheses! And since we’re seeking disconfirming evidence, it’s crucial that your test fails before the fix, and works after the fix.
This doesn’t mean TDD, or writing your test before your fix, but it does mean running your tests before and after the fix. If you noticed the bug fix PR above, you’ll see how I wrote the test afterwards. What the PR doesn’t show is my workflow that gave me confidence in the fix and the test.
My workflow goes something like: I write the fix, commit to a git branch, then I write a test and see it pass. Now, before committing the test, I git checkout HEAD~3 or git checkout master (i.e. go back 3 commits: or however many it took to fix the bug), then run the test, and see it fail.
If the test on master passes, either you’re testing the wrong thing, your test doesn’t work, or your fix didn’t actually fix the problem, since the test passed both before and after.
It’s this “watching things fail –> writing code to fix –> watching things pass” loop that grants confidence in your code.
End Notes
One mystery remains: where does the ping request type come from? The hint was in {transport: 'sendbeacon'} above. This link is very interesting!
And, that’s all for the session recording mysteries! Caught your fancy? PostHog is hiring.

What did you think of this post? Let me know on Twitter. I’m super excited about all the experiments I can run, working with an open source company!
-
I’m probably more excited about the “actual code” bit than the “bug” bit. I’m looking forward to all the experiments I can run working at an open company. This is #2. ↩
-
This was me incorrectly inferring the test data. Since I’ll click refresh, then switch to the server logs, it made it seem like it happened after refresh, when in fact, it was right before. ↩
You might also like
- AI Made Me Braver
- How I'm Productive with Claude Code
- Agentic Debt
- What I learned about burnout and anxiety at 30