
Averages are Meaningless*
“On average, every 14 minutes someone finds love on eHarmony.”
or so said the ad on the tube to Westminster.
Does that mean I’ll find love on eHarmony in 14 minutes? Not quite.
Maybe someone else will? I don’t care.

A few years ago, I tried to learn to swim.
I read online, “On average, it takes 20 hours to learn to swim.” Okay, that’s not too bad. And, I’m above average.
20 hours of lazying around in the swimming pool and I was nowhere close to learning to swim. I did find a way to keep my head underwater for 3 seconds though. That’s progress, right?
What now? Wasn’t I above average? Wasn’t the average time 20 hours? Isn’t below average … bad?
Well, averages are meaningless.
Genesis
What one data point can replace all the data points in my collection?
This question gave birth to the average. The average is one answer, among many.
It began with Astronomy. Every astronomer wanted to figure out the distance between planets and the sun. Everyone tried their own methods - and repeated others methods too. In the end, they had a tonne of measurements. How to figure out which one is correct? How could they minimise error?
The answer was taking an average of all the values. They believed that positive errors would balance out the negative errors.
They were thinking in terms of the normal distribution. And indeed, the normal distribution makes sense here. Most competent astronomers would take similar measurements - and sometimes errors with the instruments would skew their results to one side or the other - but not always.
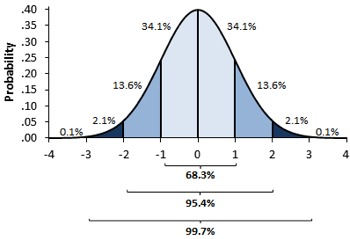
Bell Curve = Normal Distribution. Source
Soon thereafter came the second use case for averages: estimation1. Instead of counting all the berries in the bush, you would take one section of the bush. One that looks average, representative of all the other sections. Count all the berries in this section, multiply with number of sections and you get total berries in the bush. Food planning done. On average, no one will go hungry.
Another example is war. How did generals figure out the number of enemies they had to defeat? Standing across the battlefield, you wouldn’t want to spend your time counting each enemy soldier. You’d estimate their numbers instead. How? Using the average - the representative value. Count soldiers in a representative company, multiply by number of companies and you have the enemy army count.
These ideas of averages began to spread.
-
For figuring out measurement values precisely.
-
For estimation
In both use cases, we were working with a normal distribution. What’s more than average is balanced out by what’s less than average. That gave us a nice representative value.
Exponentiation
As averages started to work with estimation and measurement, people who worked with averages started to see the benefits. They’d win wars, be more successful with food planning, and make leaps in science.
Over time, we’ve come to believe that averages work everywhere.
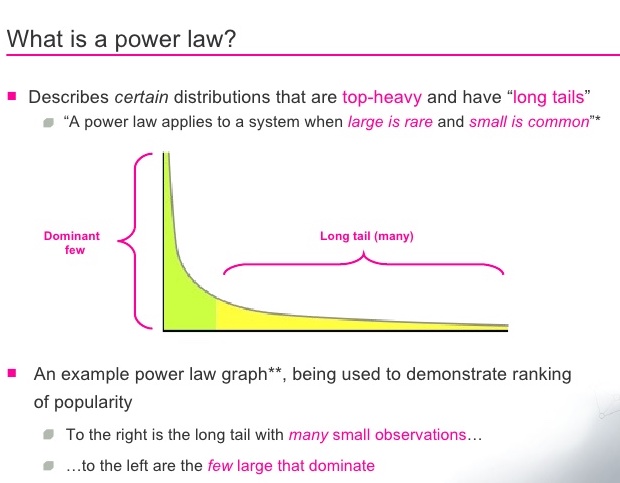
But, we’ve entered an age of compounding. The normal isn’t the norm. As soon as we created leverage, we skewed the normal distribution to one side. We created the power law distribution.
Our brains still think in terms of the normal distribution. We fail to think about the distribution when talking about statistics. Indeed, that’s why the 80/20 principle was so revolutionary. It reminded everyone that normal distributions aren’t the norm anymore.
What remains normally distributed are areas where we still don’t have leverage. We don’t know how to make someone live for a 1000 years, yet.
What the average means is derived from the distribution. We implicitly assume everything is a normal distribution. 2
Next, it makes sense to explore how exponentiation changes averages.
In the modern world, I think there are two main contexts in which we talk about averages.
- When we project the average on the world
- When we project the average on ourselves
Note: Everywhere I use normal distribution, I mean approximately normal. This is characterised by a fat middle and tapering edges. It’s rare that a real world dataset follows normal distribution exactly. Likewise for power law distribution.
Projecting averages on the world
Like our ancestors, in this case you’re figuring out the one representative value. A representative value for some metric in the world you want to understand.
However, the one isn’t everyone - so you’re always missing out on something. (The map isn’t the territory)
Asking questions like, What does the average person look like? How much does the average person weigh? make sense.
The population looks and weight are normally distributed - so your average is indeed a representative value. Roughly half the people are below average, half above.3 So, the average gives you a reasonable metric to build around. (We explore this further, below)
On the flip side, as soon as we enter power law distribution territory - our averages stop making sense.
The average, a linear combination of all data points - is meaningless when it comes to a power distribution. Your data is so skewed to one side, that 80% of people are below the average. If this sounds ridiculous, that’s where what we see and what we think it means diverge. Average is “supposed” to mean the 50% division? That’s the median. Luckily, the median and average are the same in a normal distribution.
Where do all these meaningless averages show up?
Here are just a few examples.
The average revenue per customer.
Book sales.
Average household income.
Say, you’re starting a new book, as a business decision. You want to earn - and you see that books on average make about $20,000. Sounds great, right? But 90% of authors make less than the average. If that makes you feel angry, distraught or wronged, you’re not alone. Now you know how that’s possible. Book sales also follow a power law distribution.
Meaningless average - 1. You - 0.
Say, you’re A/B testing revenue generated on your website. In version A, the website is blue. In version B, the website is green. Your judging metric - average revenue for the A/B testing period. A massive client comes and buys out almost everything on the blue version - a client that’s blue-green colourblind. You receive a fake signal: “Blue works so much better than green!” Does it really? Your average revenue says so.
So, your metric is broken. (You should be tracking conversions, not the average $$ amount per conversion.)
Projecting averages on someone
What our ancestors never had, was enough data to apply the average on themselves.4
The other way we use averages is when we project the population averages on someone - ourselves, our friends or our toys.
The good bit - humans are in a normal distribution, so averages are representative.
The bad bit - not everyone is average.
The best way to grasp this is through an example.
On average, humans take about 66 days to build a new habit. Does that mean you stop trying to build habits after 66 days? Sorry, nope.
Average is a benchmark for the population - for external people to judge their products. For example, if I were building a habit building app, I’d design it around the 66 days mark. That’s because majority of the population will take around 66 days to build a habit (normal distribution).
On the otherhand, you’re in the population. The average is meaningless to you. All it tells you is, if you were in a group of people building habits (you’re not), then most people would take somewhere around 66 days to build a habit (you don’t care)3. Doesn’t help you build habits, does it?
Sure, it sets some expectations. You might take 66 days. But unless you try it out, you wouldn’t know.
You’re a single data point, not the statistic. You could be an outlier or the average - it doesn’t matter, you need to figure it out for yourself. Ergo, averages (when projected on someone) are meaningless.
Another place where averages might have messed up our thinking is stereotypes.
I think stereotypes are true for the average person of a community. But like we’ve seen, the average is not one specific human. If you swear by stereotypes to judge a person - you’re falling for the average fallacy.5
On average, Jews are good with money. That’s a stereotype. Does it tell you anything about the Jew in front of you? I don’t think so.6 The only way to figure it out is to check their bank statements.
This projection is distribution-agnostic. Whatever the distribution, you’re making a mistake by judging an individual using the average. The distribution governs how steep the mistake can get.
This is where the venture capital games begin. When the underlying distribution is a power law, the risk and reward are higher. Have you ever heard a VC firm even talk about the average with companies? The average company is dead. They are in the game to find the winners - finding an average company isn’t good enough.
The distribution
We’ve established the tight coupling of averages to the distribution.
The final question is, How do you figure out the distribution?
I think there are two ways to do this, without becoming a statistics wizard.
How do we know that weight is normal distributed?
Some say intuition. You’ve never seen someone > 200 Kgs. Even the world record is just 500 Kgs. That’s one small car. On the flip side, no one weighs 1 Kg. Most people are fit or slightly obese. Some are super thin, some huge - but they both balance each other out.
What generates this intuition? Data. The way I see it, intuition is data. Developing intuition takes time? That’s just data collection. You’ve been meeting people all your life - that’s all the data you’ve been collecting. Sure, you might not know their weights - but your data collection is so rich that you can derive their weight.
In the end, the bell curve sounds plausible to you. In statistics, this is called sampling. You’re collecting a little bit of data to figure out the entire population.
Intuition is data
It has its pitfalls. What if all the data you’ve collected is for your locality only? What if everyone you’ve ever met is fit, at a solid 70 Kgs?
In this case, you become an outsider. You don’t know what’s going on. You can’t rely on intuition to figure out the distribution.
And that’s where real data comes in. You seek people who’ve collected this data from around the world. And you plot it. Visualising your data is an easy way to figure out the trends - and choose between a power or normal distribution. It might be neither.
It’s beautiful how intertwined both methods are. Once you start seeing intuition as data - they really do merge. The former is relying on personal data collection, the latter on data collected by others.
Towards statistical wizardry come distribution tests. These are much more rigorous and precise. I found a brief intro here.
Conclusion
Averages when taken out of context are meaningless. Just like “That’s what she said” jokes.
This used to work earlier because we only had one context - the normal distribution. Not anymore.
So, don’t fall for the average fallacy. The person in front of you is not the stereotype. They might conform to it, but you’ll have to find out for yourself.
And, don’t talk about averages without mentioning the distribution. Explicit is better than implicit. If it’s not a normal distribution, the meaning of average changes7. You go from 50% people are below average to 80% people are below average.
As for me? This is just another piece of the puzzle, as I attempt to understand the world. Join me.
*: Not really meaningless, just in specific cases.
-
Or before astronomy, we aren’t sure. The records aren’t intact. ↩
-
Explicit is better than implicit. ↩
-
Mean, median and mode for a normal distribution are the same - which gives it the intuitive feeling of averages we expect. ↩ ↩2
-
A counter argument here could be that they had their own tribes and ideas about other tribes (that sucked). Pretty similar to modern times, in this sense. ↩
-
I always wanted to name a cognitive bias. Yeah, I’m being computationally kind with the names. ↩
-
It might tell you the probability for them being good with money is greater than some other non-Jew - but that doesn’t help. On the flip side, if you were trying to choose good money managers, you’ll find more money managers that are Jews. Assuming the stereotype is true. ↩
-
How it’s calculated, or what the calculation is doesn’t change. What it signifies changes. ↩
You might also like
- Second Order Thinking - A Practical Guide
- How To Understand Systems
- The Human Log
- How the medium earning algorithm works